
 By Nila Kartika Wati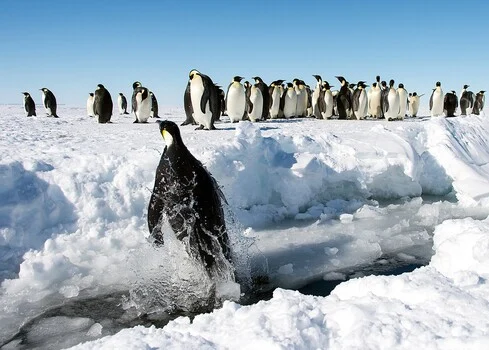
The seemingly pristine white expanse of Antarctica holds a hidden narrative, one meticulously charted not by intrepid explorers on foot, but by orbiting satellites capturing the reddish-brown excretions of its most iconic residents: emperor penguins. For years, the majestic four-foot-tall birds, weighing up to 90 pounds, remained elusive to direct satellite observation due to their diminutive size relative to orbital camera resolution. Yet, their collective "mess"—vast smears of guano staining the sea ice—has become an invaluable, high-contrast signature, allowing scientists to locate and monitor roughly half of all known emperor penguin colonies and, more recently, to document a startling and accelerated decline in their populations. This innovative remote sensing technique, born from a "photographer’s trick" applied at a planetary scale, has revolutionized ornithological research in one of the planet’s most inaccessible environments, while simultaneously providing a sobering, ongoing record of climate change’s impact.
The Unseen Subject: A Revolution in Wildlife Monitoring
Traditional methods for surveying emperor penguin colonies involved arduous and costly expeditions, often relying on aerial surveys, ship-based observations, or dangerous treks across treacherous sea ice. These efforts were inherently limited by logistics, weather conditions, and the sheer scale of the Antarctic continent, which hosts breeding colonies in some of the coldest, darkest, and most remote locations on Earth. The very nature of emperor penguins’ breeding cycle—spending the harsh Antarctic winter packed shoulder-to-shoulder on stable fast ice from April until their chicks fledge in December—means their presence is tied to highly specific, often transient, habitats.
The breakthrough arrived not from attempting to spot individual birds, which at 30 meters per pixel (Landsat) or even 10 meters per pixel (Copernicus Sentinel-2) are far too small to register, but by focusing on their communal byproduct. Thousands of penguins congregating for months in one location create a substantial, unmistakable discoloration on the otherwise stark white ice. This accumulated guano, a reddish-brown stain sprawling across tens or even hundreds of meters, acts as a macroscopic beacon visible from hundreds of miles above. This paradigm shift in observation, moving from the animal itself to the evidence it leaves behind, proved to be the key to unlocking the secrets of their distribution. As scientists realized, sometimes the most effective way to photograph a hidden subject is to capture its shadow, its wake, or in this case, its waste.
Satellite Eyes: The Technology Behind the Discovery
The success of satellite-based penguin monitoring hinges on the interplay of ground sample distance (GSD), spectral resolution, and image processing techniques. Early efforts, spearheaded by Peter Fretwell and Phil Trathan of the British Antarctic Survey (BAS), utilized publicly available imagery from NASA’s Landsat program. Landsat satellites, operating since the 1970s, provide relatively coarse resolution, with color bands at 30 meters per pixel and a sharper panchromatic channel at 15 meters per pixel. While individual penguins remain invisible at these scales, large guano stains become discernible brown smudges against the highly reflective white ice.
The European Commission’s Copernicus Sentinel-2 satellites, launched later, offer improved resolution at 10 meters per pixel for their color bands, making the detection of these stains even more reliable. A hundred-meter guano stain, for instance, appears as a distinct ten-pixel-wide target on Sentinel-2 imagery, easily flagged by automated computer algorithms designed to identify brown anomalies on a white background. This continent-wide, freely accessible imagery is ideal for the initial "finding" stage of the survey.
For the second, more detailed task—counting the birds—much higher resolution is required. This relies on commercial satellites such as Maxar’s WorldView-3, which can resolve surface features down to approximately 31 centimeters per pixel from an orbit of about 380 miles. At this unprecedented scale, an emperor penguin finally registers as a dark clump a few pixels wide. Researchers don’t count individual birds directly but instead classify the shapes and densities of penguin huddles, converting the area covered into a population estimate using known densities from ground-truthed colonies. This approach mirrors how crowd sizes are estimated from aerial photos of stadiums, rather than counting every face.
Beyond spatial resolution, spectral bands play a crucial role. Satellites capture multiple channels of the electromagnetic spectrum simultaneously. The high-resolution panchromatic band provides fine detail, while coarser color and near-infrared bands carry spectral information essential for distinguishing guano (brown/reddish-brown) from other potential features like blue melt pools, gray exposed rock, or long shadows. Analysts often "pan-sharpen" images by fusing the sharp gray layer with lower-resolution color data to achieve a clearer, more informative picture. Crucially, promising stains are cross-referenced with repeat passes and higher-resolution commercial frames to avoid false positives, ensuring that only genuine colonies are recorded.
A Chronology of Discovery and Decline
The journey of mapping emperor penguins from space began subtly in 2009. Peter Fretwell and Phil Trathan, while examining freely available Landsat imagery of the Antarctic coastline, repeatedly observed brown patches on the sea ice that correlated with known emperor penguin breeding sites. This observation sparked a pivotal hypothesis: if these stains marked existing colonies, then similar unexplained stains might indicate previously undiscovered ones.
Their subsequent investigation, utilizing the Landsat Image Mosaic of Antarctica (a composite map covering about 90% of the continent’s coastline), yielded revolutionary results. Published in the journal Global Ecology and Biogeography, their study identified 38 colonies, with ten being entirely new to science. The imagery also corrected the locations of six previously known colonies, repositioning them by over 10 kilometers due to inaccuracies in older geographic records. Six other colonies could not be found, suggesting they might have been temporary or moved. This marked a profound shift in methodology for a species inhabiting such extreme environments, demonstrating that a single person at a computer could achieve what once required immense logistical effort and risk.
Building on this success, a team led by Fretwell published a landmark paper in PLoS ONE in 2012, presenting what they described as "the first global, synoptic survey of a species from space." This comprehensive census combined very high-resolution imagery from satellites like QuickBird, WorldView-2, and Ikonos, covering the entire Antarctic coastline. Sophisticated image processing algorithms were employed to classify pixels into snow, shadow, guano, and penguins. The software, trained on known samples, could effectively differentiate between these elements. Ground-truthed counts from a handful of colonies were used to calibrate the satellite data, allowing researchers to accurately estimate the number of birds based on the classified areas.
The findings reset scientific understanding: the survey estimated approximately 238,000 breeding pairs, scaling up to roughly 595,000 adult birds when non-breeders were included. This nearly doubled previous estimates, which had ranged between 270,000 and 350,000. Michelle LaRue, a co-author and specialist in remote Antarctic animal censuses, emphasized the rigor and scientific validity of this remote sensing approach, proving it to be far from a gimmick.
However, the precision of these counts is nuanced. Satellite images are snapshots, and penguin colonies are dynamic. Birds spread out on mild days and huddle tightly during storms, affecting the visible footprint. Therefore, estimates carry inherent error bars, and observed fluctuations in colony size between images necessitate sophisticated correction models that account for behavioral variations.
The same powerful methodology designed to discover and count has, in recent years, also become a tool for documenting loss. In 2019, Fretwell and Trathan reported in Antarctic Science on the catastrophic breeding failures at Halley Bay, formerly the second-largest emperor penguin colony, hosting 14,000 to 25,000 breeding pairs. From 2016 to 2018, the colony experienced three consecutive years of near-total chick mortality. Satellite imagery clearly showed the cause: premature and repeated breakup of the stable fast ice that emperor penguins depend on for their entire breeding season. Concurrently, imagery revealed a dramatic increase in the nearby Dawson-Lambton Glacier colony, suggesting a mass relocation of adults seeking more stable ice.
The map of emperor penguin colonies continues to evolve. In 2020, Sentinel-2 imagery uncovered 11 more colonies, bringing the global count to 61. Another surfaced at Verleger Point in early 2023. Most recently, in January 2024, the British Antarctic Survey announced four additional colonies, identified via Sentinel-2 and confirmed with sharper Maxar WorldView-3 data, elevating the known total to 66 colonies around the continent. Fretwell noted that these discoveries "fill in almost all the gaps in the known distribution of these iconic birds," underscoring how remote sensing has provided an unprecedented, near-complete inventory.
The Guano Code: What Penguin Droppings Reveal
The choice of guano as a target is not merely about its convenient visibility; its exact hue carries additional scientific information. The color of penguin droppings is directly influenced by their diet. A diet rich in krill, a small crustacean, results in pinker or reddish stains, while a fish-heavy diet yields paler excretions. Emperor penguins consume a mix of fish, squid, and krill, typically painting the ice in various shades of brown and reddish-brown.
This reddish tint is attributed to astaxanthin, a carotenoid pigment abundant in krill, which penguins cannot fully metabolize. It passes through their digestive system, coloring their waste. Spectrometric analysis of penguin droppings (though primarily on Pygoscelis species like Adélie, chinstrap, and gentoo penguins from Signy Island) reveals a broad absorption feature around 550 nanometers in the green part of the spectrum, which the human eye perceives as pink or red. While this specific research hasn’t yet allowed for species differentiation by guano color, it has paved the way for "diet-from-orbit" studies, particularly with Adélie penguins, where guano color in satellite imagery is used to infer a colony’s feeding patterns without any direct interaction with the birds.
From a photographic perspective, this phenomenon is a triumph of color science. The vast Antarctic ice sheet functions as a near-perfect neutral backdrop, reflecting almost all wavelengths of light. Dropping a highly saturated brown or red target onto this neutral canvas creates an enormous contrast, particularly evident in red-minus-white comparisons. This is analogous to how a red jacket vividly stands out against snow in a winter photograph. The penguins, in essence, are decorating the world’s largest neutral backdrop with the very color that ensures their visibility from space.
Climate Change’s Shadow: Documenting Loss from Orbit
The unparalleled survey method, while excellent for discovery, also provides an unforgiving record of environmental change and population decline. The situation at Halley Bay serves as a stark warning. The complete breeding failures between 2016 and 2018 were a direct consequence of the early and repeated disintegration of stable fast ice. Emperor penguins critically depend on this ice platform from the time adults arrive in April until their chicks develop waterproof feathers in December. The satellite imagery not only documented the ice breakup but also captured the subsequent mass relocation of adults to the Dawson-Lambton Glacier colony, 55 kilometers to the south, which swelled significantly during the same period. This visible exodus underscores the immediate and dramatic impact of habitat loss.
The broader implications are deeply concerning. The latest data, published in June 2025 by a Fretwell-led team in Communications Earth & Environment, reveals an alarming trend: emperor penguin numbers fell by approximately 22 percent over fifteen years (2009 to 2023) across a significant sector of Antarctica, from Dronning Maud Land to the Bellingshausen Sea, including the entire Antarctic Peninsula. This region accounts for roughly 30 percent of the global emperor penguin population. This figure is considerably steeper than the 9.5 percent decline observed across the whole continent between 2009 and 2018, indicating an accelerating crisis in certain vulnerable areas.
The researchers’ assessment is stark. Fretwell stated that this drop is "worse than the worst-case projections we have for emperors this century." Co-author Phil Trathan emphasized the need for a deeper understanding, noting, "The fact that we’re moving to a position faster than the computer models project means there must be other factors we need to understand in addition to loss of breeding habitat." He unequivocally linked the species’ future to climate action: "The only way we’ll see a turnaround for the population is if we stabilise greenhouse gas emissions."
While unreliable sea ice remains the primary long-term threat for a species entirely dependent on stable ice for breeding, the accelerated decline suggests additional pressures. Researchers point to shifting storm, snow, and rainfall patterns, increased competition for food resources as other species expand their ranges southward, and heightened predation from petrels, seals, and killer whales operating in newly open waters.
Counting the Uncountable: Global Census and Future Outlook
The capacity to monitor an entire species from orbit, initially celebrated for revealing a larger population than previously thought, has now become an indispensable tool for documenting its precarious future. Every year, the satellite archive gains another layer, another frame in a time-lapse recording a crisis that no one desired to capture. The dignity in this documentation lies in its objectivity and relentless consistency. The penguins themselves, through their accumulated waste, are signaling their presence and, increasingly, their struggle.
This remote sensing methodology represents a significant advancement in conservation science. It provides objective, consistent, and scalable data that would be impossible to gather through traditional means, especially for species inhabiting such remote and challenging environments. It allows for the identification of previously unknown populations, the precise mapping of their locations, and, critically, the long-term tracking of population dynamics and habitat changes linked to climate change.
The most important "wildlife photograph" of the emperor penguin may indeed be one where not a single bird is visible, but where the brown stains on the white ice tell a story of life, resilience, and ultimately, a species grappling with an uncertain future in a rapidly changing world. The satellites continue their vigil, providing an unvarnished, month-by-month record of the profound impact of global warming on Antarctica’s most iconic avian resident.
